| Type: | Package |
| Title: | Measles Epidemiological Models |
| Version: | 0.1.0 |
| Depends: | R (≥ 4.1.0), epiworldR (≥ 0.11.0.1) |
| Description: | A specialized collection of measles epidemiological models built on the 'epiworldR' framework. This package is a spinoff from 'epiworldR' focusing specifically on measles transmission dynamics. It includes models for school settings with quarantine and isolation policies, mixing models with population groups, and risk-based quarantine strategies. The models use Agent-Based Models (ABM) with a fast 'C++' backend from the 'epiworld' library. Ideal for studying measles outbreaks, vaccination strategies, and intervention policies. |
| URL: | https://github.com/UofUEpiBio/measles |
| BugReports: | https://github.com/UofUEpiBio/measles/issues |
| License: | MIT + file LICENSE |
| RoxygenNote: | 7.3.3 |
| Encoding: | UTF-8 |
| LinkingTo: | cpp11, epiworldR |
| Imports: | utils |
| Suggests: | tinytest, data.table, quarto |
| VignetteBuilder: | quarto |
| LazyData: | true |
| NeedsCompilation: | yes |
| Packaged: | 2026-02-03 18:26:59 UTC; runner |
| Author: | George Vega Yon  [aut, cre],
Damon Toth [ctb],
Jake Wagoner
[ctb],
Olivia Banks
[ctb],
Centers for Disease Control and Prevention [fnd] (Award number
1U01CK000585; 75D30121F00003)
[aut, cre],
Damon Toth [ctb],
Jake Wagoner
[ctb],
Olivia Banks
[ctb],
Centers for Disease Control and Prevention [fnd] (Award number
1U01CK000585; 75D30121F00003) |
| Maintainer: | George Vega Yon <g.vegayon@gmail.com> |
| Repository: | CRAN |
| Date/Publication: | 2026-02-12 08:10:14 UTC |
measles: Measles Epidemiological Models
Description
A specialized collection of measles epidemiological models built on the epiworldR framework. This package provides models for studying measles transmission dynamics, including school settings with quarantine and isolation policies, mixing models with population groups, and risk-based quarantine strategies.
Author(s)
Maintainer: George Vega Yon g.vegayon@gmail.com (ORCID)
Other contributors:
Damon Toth damon.toth@hsc.utah.edu (ORCID) [contributor]
Jake Wagoner jakew@sci.utah.edu (ORCID) [contributor]
Olivia Banks olivia.banks@utah.edu (ORCID) [contributor]
Centers for Disease Control and Prevention (Award number 1U01CK000585; 75D30121F00003) [funder]
See Also
Useful links:
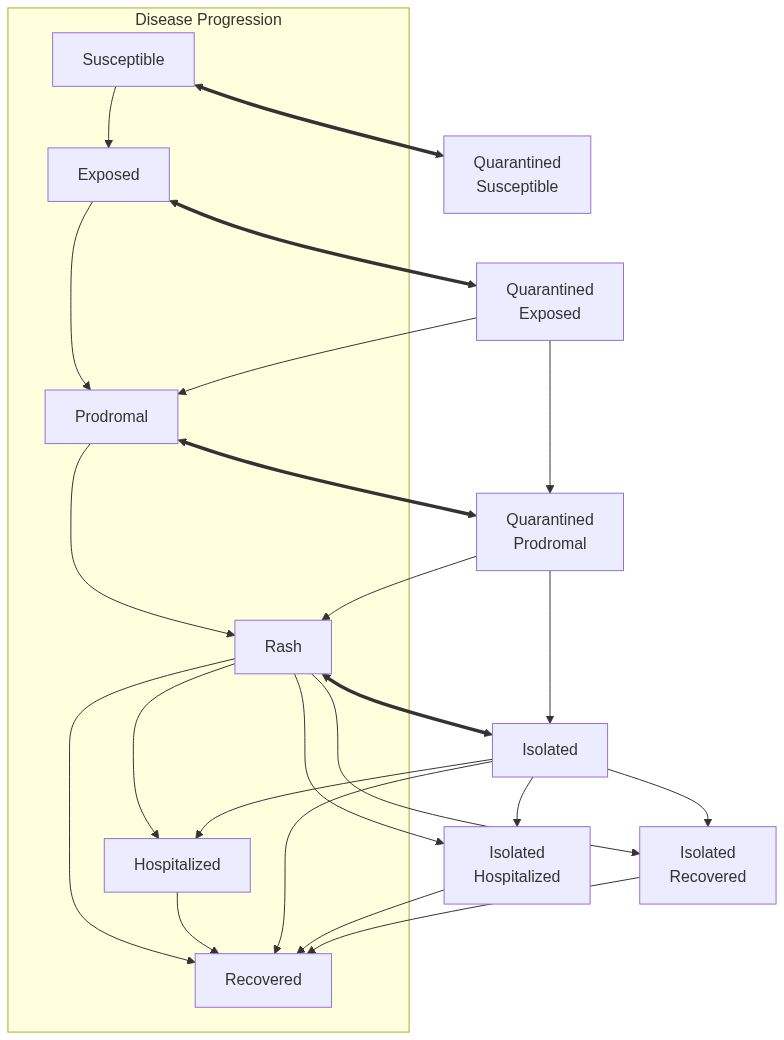
Measles model with mixing
Description
ModelMeaslesMixing creates a measles epidemiological model with mixing
between different population groups. The model includes vaccination,
quarantine, isolation, and contact tracing mechanisms.
Usage
ModelMeaslesMixing(
  n,
  prevalence,
  contact_matrix,
  vax_reduction_recovery_rate = 0.5,
  transmission_rate = 0.9,
  contact_rate = 15/transmission_rate/prodromal_period,
  prop_vaccinated,
  vax_efficacy = 0.99,
  quarantine_period = 21,
  quarantine_willingness = 1,
  isolation_willingness = 1,
  isolation_period = 4,
  incubation_period = 12,
  prodromal_period = 4,
  rash_period = 3,
  hospitalization_rate = 0.2,
  hospitalization_period = 7,
  days_undetected = 2,
  contact_tracing_success_rate = 1,
  contact_tracing_days_prior = 4
)
Arguments
n |
Number of individuals in the population. |
prevalence |
Double. Initial proportion of individuals with the virus. |
contact_matrix |
A row-stochastic matrix of mixing proportions between population groups. |
vax_reduction_recovery_rate |
Double. Vaccine reduction in recovery rate (default: 0.5). |
transmission_rate |
Numeric scalar between 0 and 1. Probability of transmission (default: 0.9). |
contact_rate |
Numeric scalar. Average number of contacts per step. |
prop_vaccinated |
Double. Proportion of population that is vaccinated. |
vax_efficacy |
Double. Vaccine efficacy rate (default: 0.99). |
quarantine_period |
Integer. Number of days for quarantine (default: 21). |
quarantine_willingness |
Double. Proportion of agents willing to quarantine (default: 1). |
isolation_willingness |
Double. Proportion of agents willing to isolate (default: 1). |
isolation_period |
Integer. Number of days for isolation (default: 4). |
incubation_period |
Double. Duration of incubation period (default: 12). |
prodromal_period |
Double. Duration of prodromal period (default: 4). |
rash_period |
Double. Duration of rash period (default: 3). |
hospitalization_rate |
Double. Rate of hospitalization (default: 0.2). |
hospitalization_period |
Double. Period of hospitalization (default: 7). |
days_undetected |
Double. Number of days an infection goes undetected (default: 2). |
contact_tracing_success_rate |
Double. Probability of successful contact tracing (default: 1.0). |
contact_tracing_days_prior |
Integer. Number of days prior to the onset of the infection for which contact tracing is effective (default: 4). |
Details
The contact_matrix is a matrix of contact rates between entities. The
matrix should be of size n x n, where n is the number of entities.
This is a row-stochastic matrix, i.e., the sum of each row should be 1.
The model includes three distinct phases of measles infection: incubation, prodromal, and rash periods. Vaccination provides protection against infection and may reduce recovery time.
The epiworldR::initial_states function allows the user to set the initial state of the model. In particular, the user can specify how many of the non-infected agents have been removed at the beginning of the simulation.
The default value for the contact rate is an approximation to the disease's basic reproduction number (R0), but it is not 100% accurate. A more accurate way to se the contact rate is available, and will be distributed in the future.
Value
The
ModelMeaslesMixingfunction returns a model of classes epiworldR::epiworld_model and epiworld_measlesmixing.
Model diagram
See Also
epiworld-methods
Other Models:
ModelMeaslesMixingRiskQuarantine(),
ModelMeaslesSchool()
Other measles models:
ModelMeaslesMixingRiskQuarantine(),
ModelMeaslesSchool()
Examples
# Start off creating three entities.
# Individuals will be distributed randomly between the three.
e1 <- entity("Population 1", 3e3, as_proportion = FALSE)
e2 <- entity("Population 2", 3e3, as_proportion = FALSE)
e3 <- entity("Population 3", 3e3, as_proportion = FALSE)

# Row-stochastic matrix (rowsums 1)
cmatrix <- c(
  c(0.9, 0.05, 0.05),
  c(0.1, 0.8, 0.1),
  c(0.1, 0.2, 0.7)
) |> matrix(byrow = TRUE, nrow = 3)

N <- 9e3

measles_model <- ModelMeaslesMixing(
  n                        = N,
  prevalence               = 1 / N,
  contact_rate             = 15,
  transmission_rate        = 0.9,
  vax_efficacy             = 0.97,
  vax_reduction_recovery_rate = 0.8,
  incubation_period        = 10,
  prodromal_period         = 3,
  rash_period              = 7,
  contact_matrix           = cmatrix,
  hospitalization_rate     = 0.1,
  hospitalization_period   = 10,
  days_undetected          = 2,
  quarantine_period        = 14,
  quarantine_willingness   = 0.9,
  isolation_willingness    = 0.8,
  isolation_period         = 10,
  prop_vaccinated          = 0.95,
  contact_tracing_success_rate = 0.8,
  contact_tracing_days_prior = 4
)

# Adding the entities to the model
measles_model |>
  add_entity(e1) |>
  add_entity(e2) |>
  add_entity(e3)

set.seed(331)
run(measles_model, ndays = 100)
summary(measles_model)
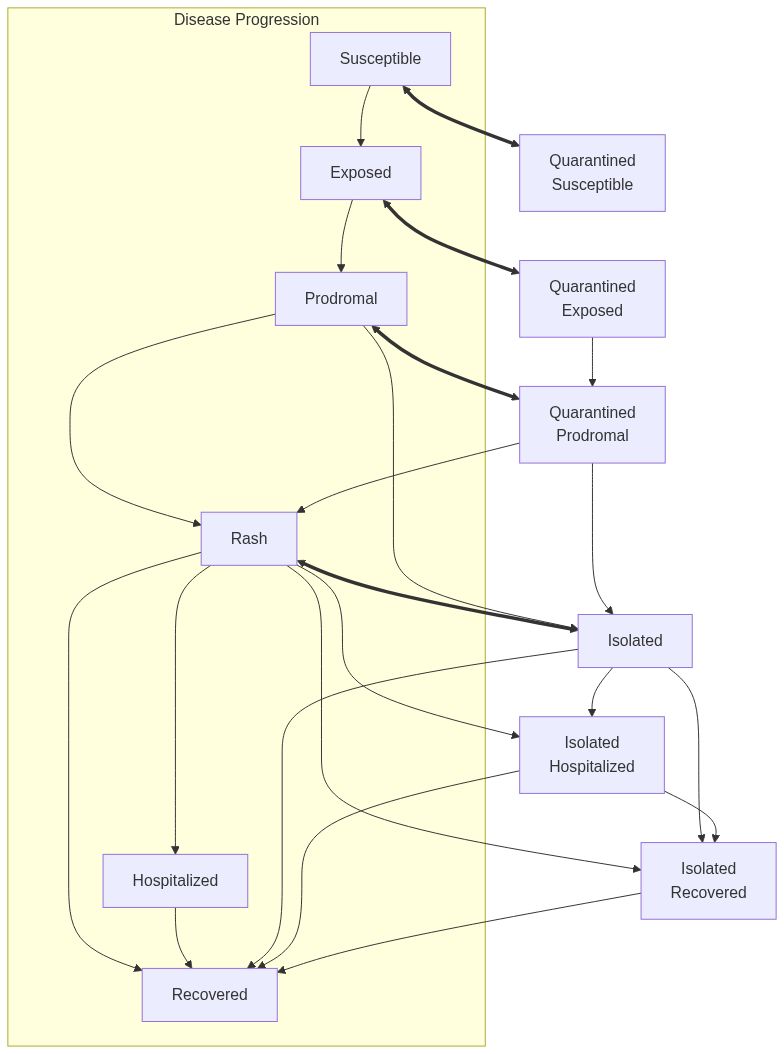
Measles model with mixing and risk-based quarantine
Description
ModelMeaslesMixingRiskQuarantine creates a measles epidemiological model with mixing
between different population groups and risk-based quarantine strategies. The model
includes vaccination, quarantine with three risk levels (high, medium, low), isolation,
and contact tracing mechanisms.
Usage
ModelMeaslesMixingRiskQuarantine(
  n,
  prevalence,
  contact_matrix,
  transmission_rate = 0.9,
  contact_rate = 15/transmission_rate/prodromal_period,
  prop_vaccinated,
  vax_efficacy = 0.99,
  quarantine_period_high = 21,
  quarantine_period_medium = 14,
  quarantine_period_low = 7,
  quarantine_willingness = 1,
  isolation_willingness = 1,
  isolation_period = 4,
  incubation_period = 12,
  prodromal_period = 4,
  rash_period = 3,
  hospitalization_rate = 0.2,
  hospitalization_period = 7,
  days_undetected = 2,
  detection_rate_quarantine = 0.5,
  contact_tracing_success_rate = 1,
  contact_tracing_days_prior = 4
)
Arguments
n |
Number of individuals in the population. |
prevalence |
Double. Initial proportion of individuals with the virus. |
contact_matrix |
A row-stochastic matrix of mixing proportions between population groups. |
transmission_rate |
Numeric scalar between 0 and 1. Probability of transmission (default: 0.9). |
contact_rate |
Numeric scalar. Average number of contacts per step. |
prop_vaccinated |
Double. Proportion of population that is vaccinated. |
vax_efficacy |
Double. Vaccine efficacy rate (default: 0.99). |
quarantine_period_high |
Integer. Number of days for quarantine for high-risk contacts (default: 21). |
quarantine_period_medium |
Integer. Number of days for quarantine for medium-risk contacts (default: 14). |
quarantine_period_low |
Integer. Number of days for quarantine for low-risk contacts (default: 7). |
quarantine_willingness |
Double. Proportion of agents willing to quarantine (default: 1). |
isolation_willingness |
Double. Proportion of agents willing to isolate (default: 1). |
isolation_period |
Integer. Number of days for isolation (default: 4). |
incubation_period |
Double. Duration of incubation period (default: 12). |
prodromal_period |
Double. Duration of prodromal period (default: 4). |
rash_period |
Double. Duration of rash period (default: 3). |
hospitalization_rate |
Double. Rate of hospitalization (default: 0.2). |
hospitalization_period |
Double. Period of hospitalization (default: 7). |
days_undetected |
Double. Number of days rash goes undetected (default: 2). |
detection_rate_quarantine |
Double. Detection rate of prodromal agents during active quarantine periods (default: 0.5). |
contact_tracing_success_rate |
Double. Probability of successful contact tracing (default: 1.0). |
contact_tracing_days_prior |
Integer. Number of days prior to the onset of the infection for which contact tracing is effective (default: 4). |
Details
The contact_matrix is a matrix of contact rates between entities. The
matrix should be of size n x n, where n is the number of entities.
This is a row-stochastic matrix, i.e., the sum of each row should be 1.
The model includes three distinct phases of measles infection: incubation (exposed), prodromal, and rash periods. Vaccination provides protection against transmission.
Risk-based quarantine strategies assign different quarantine durations based on exposure risk:
-
High Risk: Unvaccinated agents who share entity membership with the case
-
Medium Risk: Unvaccinated agents who contacted an infected individual but don't share entity membership
-
Low Risk: Other unvaccinated agents
The epiworldR::initial_states function allows the user to set the initial state of the model. In particular, the user can specify how many of the non-infected agents have been removed at the beginning of the simulation.
The default value for the contact rate is an approximation to the disease's basic reproduction number (R0), but it is not 100% accurate. A more accurate way to set the contact rate is available, and will be distributed in the future.
Value
The
ModelMeaslesMixingRiskQuarantinefunction returns a model of classes epiworldR::epiworld_model and epiworld_measlesmixingriskquarantine.
Model diagram
See Also
epiworld-methods
Other Models:
ModelMeaslesMixing(),
ModelMeaslesSchool()
Other measles models:
ModelMeaslesMixing(),
ModelMeaslesSchool()
Examples
# Start off creating three entities.
# Individuals will be distributed randomly between the three.
e1 <- entity("Population 1", 3e3, as_proportion = FALSE)
e2 <- entity("Population 2", 3e3, as_proportion = FALSE)
e3 <- entity("Population 3", 3e3, as_proportion = FALSE)

# Row-stochastic matrix (rowsums 1)
cmatrix <- c(
  c(0.9, 0.05, 0.05),
  c(0.1, 0.8, 0.1),
  c(0.1, 0.2, 0.7)
) |> matrix(byrow = TRUE, nrow = 3)

N <- 9e3

measles_model <- ModelMeaslesMixingRiskQuarantine(
  n                        = N,
  prevalence               = 1 / N,
  contact_rate             = 15,
  transmission_rate        = 0.9,
  vax_efficacy             = 0.97,
  incubation_period        = 10,
  prodromal_period         = 3,
  rash_period              = 7,
  contact_matrix           = cmatrix,
  hospitalization_rate     = 0.1,
  hospitalization_period   = 10,
  days_undetected          = 2,
  quarantine_period_high   = 21,
  quarantine_period_medium = 14,
  quarantine_period_low    = 7,
  quarantine_willingness   = 0.9,
  isolation_willingness    = 0.8,
  isolation_period         = 10,
  prop_vaccinated          = 0.95,
  detection_rate_quarantine = 0.5,
  contact_tracing_success_rate = 0.8,
  contact_tracing_days_prior = 4
)

# Adding the entities to the model
measles_model |>
  add_entity(e1) |>
  add_entity(e2) |>
  add_entity(e3)

set.seed(331)
run(measles_model, ndays = 100)
summary(measles_model)
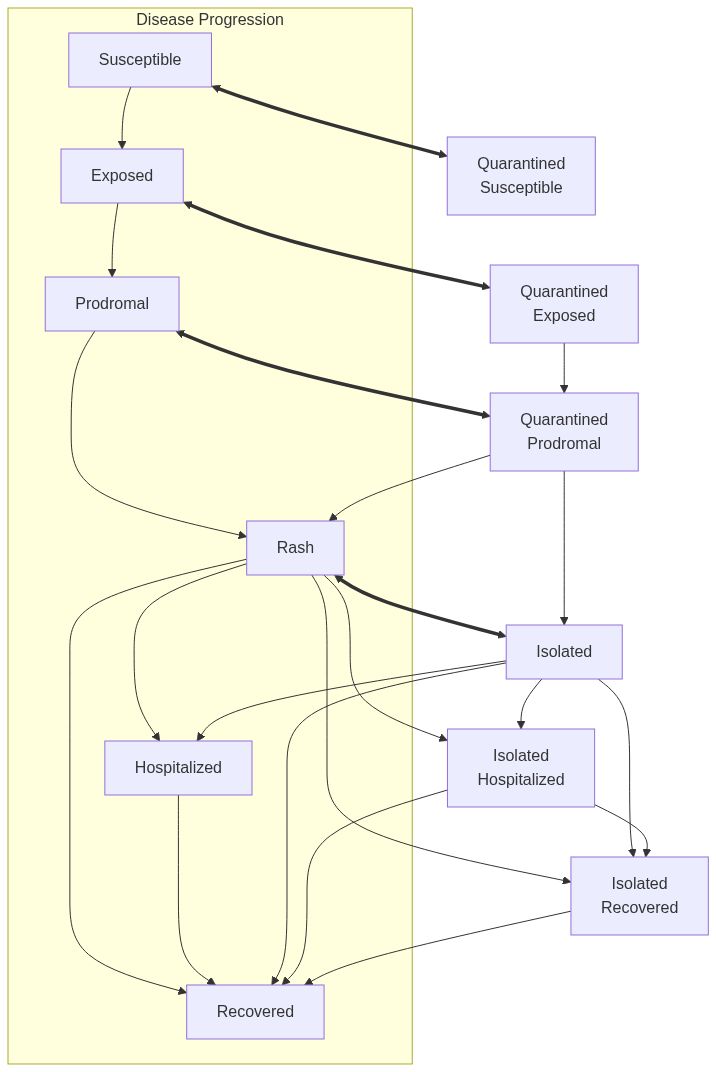
Measles model with quarantine
Description
Implements a Susceptible-Exposed-Infectious-Hospitalized-Recovered (SEIHR) model for Measles within a school. The model includes isolation of detected cases and optional quarantine of unvaccinated individuals.
Usage
ModelMeaslesSchool(
  n,
  prevalence = 1,
  contact_rate = 15/transmission_rate/prodromal_period,
  transmission_rate = 0.9,
  vax_efficacy = 0.99,
  incubation_period = 12,
  prodromal_period = 4,
  rash_period = 3,
  days_undetected = 2,
  hospitalization_rate = 0.2,
  hospitalization_period = 7,
  prop_vaccinated = 1 - 1/15,
  quarantine_period = 21,
  quarantine_willingness = 1,
  isolation_period = 4,
  ...
)

ModelMeaslesQuarantine(...)
Arguments
n |
Number of agents in the model. |
prevalence |
Initial number of agents with the virus. |
contact_rate |
Average number of contacts per step. Default is set to match the basic reproductive number (R0) of 15 (see details). |
transmission_rate |
Probability of transmission. |
vax_efficacy |
Probability of vaccine efficacy. |
incubation_period |
Average number of incubation days. |
prodromal_period |
Average number of prodromal days. |
rash_period |
Average number of rash days. |
days_undetected |
Average number of days undetected. Detected cases are moved to isolation and trigger the quarantine process. |
hospitalization_rate |
Probability of hospitalization. |
hospitalization_period |
Average number of days in hospital. |
prop_vaccinated |
Proportion of the population vaccinated. |
quarantine_period |
Number of days an agent is in quarantine. |
quarantine_willingness |
Probability of accepting quarantine ( see details). |
isolation_period |
Number of days an agent is in isolation. |
... |
Further arguments (not used). |
Details
This model can be described as a SEIHR model with isolation and quarantine. The infectious state is divided into prodromal and rash phases. Furthermore, the quarantine state includes exposed, susceptible, prodromal, and recovered states.
The model is a perfect mixing model, meaning that all agents are in contact with each other. The model is designed to simulate the spread of Measles within a school setting, where the population is assumed to be homogeneous.
The quarantine process is triggered any time that an agent with rash is
detected. The agent is then isolated and all agents who are unvaccinated are
quarantined (if willing). Isolated agents then may be moved out of the
isolation in isolation_period days. The quarantine willingness parameter
sets the probability of accepting quarantine. If a quarantined agent develops
rash, they are moved to isolation, which triggers a new quarantine process.
The basic reproductive number in Measles is estimated to be about 15. By default, the contact rate of the model is set so that the R0 matches 15.
When quarantine_period is set to -1, the model assumes
there is no quarantine process. The same happens with isolation_period.
Since the quarantine process is triggered by an isolation, then
isolation_period = -1 automatically sets quarantine_period = -1.
Value
The
ModelMeaslesQuarantinefunction returns a model of classes epiworldR::epiworld_model andepiworld_measlesquarantine.
Model diagram
Note
As of version 0.10.0, the parameter vax_improved_recovery has been removed
and is no longer used (it never had a side effect). Future versions may not
accept it.
Author(s)
This model was built as a response to the US Measles outbreak in 2025. This is a collaboration between the University of Utah (ForeSITE center grant) and the Utah Department of Health and Human Services.
References
Jones, Trahern W, and Katherine Baranowski. 2019. "Measles and Mumps: Old Diseases, New Outbreaks."
Liu, Fengchen, Wayne T A Enanoria, Jennifer Zipprich, Seth Blumberg, Kathleen Harriman, Sarah F Ackley, William D Wheaton, Justine L Allpress, and Travis C Porco. 2015. "The Role of Vaccination Coverage, Individual Behaviors, and the Public Health Response in the Control of Measles Epidemics: An Agent-Based Simulation for California." BMC Public Health 15 (1): 447. doi:10.1186/s12889-015-1766-6.
"Measles Disease Plan." 2019. Utah Department of Health and Human Services. https://epi.utah.gov/wp-content/uploads/Measles-disease-plan.pdf.
See Also
epiworld-methods
Other Models:
ModelMeaslesMixing(),
ModelMeaslesMixingRiskQuarantine()
Other measles models:
ModelMeaslesMixing(),
ModelMeaslesMixingRiskQuarantine()
Examples
# An in a school with low vaccination
model_measles <- ModelMeaslesQuarantine(
  n = 500,
  prevalence = 1,
  prop_vaccinated = 0.70
)

# Running and printing
run(model_measles, ndays = 100, seed = 1912)
model_measles

plot(model_measles)
Get and Set Contact Matrix
Description
These functions allow getting and setting the contact matrix for measles mixing models. The contact matrix specifies the mixing patterns between different population groups.
Usage
get_contact_matrix(model)

## Default S3 method:
get_contact_matrix(model)

## S3 method for class 'epiworld_measlesmixing'
get_contact_matrix(model)

## S3 method for class 'epiworld_measlesmixingriskquarantine'
get_contact_matrix(model)

set_contact_matrix(model, value)

## Default S3 method:
set_contact_matrix(model, value)

## S3 method for class 'epiworld_measlesmixing'
set_contact_matrix(model, value)

## S3 method for class 'epiworld_measlesmixingriskquarantine'
set_contact_matrix(model, value)
Arguments
model |
An epiworld model object of class |
value |
A row-stochastic matrix representing contact rates between population groups. The matrix should be square with dimensions matching the number of entities (population groups) in the model, and each row should sum to 1. |
Details
The contact matrix is a row-stochastic matrix where entry [i, j]
represents the probability that an individual in group i will make
contact with someone in group j, given that they make a contact.
Each row must sum to 1.
These functions are currently only available for:
Other mixing models in epiworld will have these methods available in the near future.
Value
-
get_contact_matrix()returns a numeric matrix representing the contact rates between population groups. -
set_contact_matrix()returns the model object invisibly (called for its side effects).
Examples
# Create entities for three population groups
e1 <- entity("Population 1", 1000, as_proportion = FALSE)
e2 <- entity("Population 2", 1000, as_proportion = FALSE)
e3 <- entity("Population 3", 1000, as_proportion = FALSE)

# Create an identity contact matrix (no mixing between groups)
cmatrix <- diag(3)

N <- 3000

# Create a measles mixing model
model <- ModelMeaslesMixing(
  n                        = N,
  prevalence               = 1 / N,
  contact_rate             = 15,
  transmission_rate        = 0.9,
  vax_efficacy             = 0.97,
  vax_reduction_recovery_rate = 0.8,
  incubation_period        = 10,
  prodromal_period         = 3,
  rash_period              = 7,
  contact_matrix           = cmatrix,
  hospitalization_rate     = 0.1,
  hospitalization_period   = 10,
  days_undetected          = 2,
  quarantine_period        = 14,
  quarantine_willingness   = 0.9,
  isolation_willingness    = 0.8,
  isolation_period         = 10,
  prop_vaccinated          = 0.95,
  contact_tracing_success_rate = 0.8,
  contact_tracing_days_prior = 4
)

# Add entities to the model
model |>
  add_entity(e1) |>
  add_entity(e2) |>
  add_entity(e3)

# Get the contact matrix (note: requires running the model first)
set.seed(123)
run(model, ndays = 10)
original_matrix <- get_contact_matrix(model)
print(original_matrix)

# Create a new random row-stochastic matrix
new_matrix <- matrix(
  c(0.8, 0.1, 0.1,
    0.1, 0.7, 0.2,
    0.15, 0.15, 0.7),
  nrow = 3, byrow = TRUE
)

# Set the new contact matrix
set_contact_matrix(model, new_matrix)

# Verify the change
updated_matrix <- get_contact_matrix(model)
print(updated_matrix)
Short Creek Population Data by Age Group
Description
A dataset containing population information for the Short Creek area (Hildale city, Utah, Colorado City town, Arizona, and Centennial Park, Arizona) organized by age groups.
Usage
short_creek
Format
A data frame with 15 rows and 4 columns:
- age_labels
character. Labels describing the age groups.
- agepops
numeric. Population counts for each age group.
- agelims
numeric. Age limit boundaries for each group.
- vacc_rate
numeric. Vaccination rate for each age group.
Details
This dataset provides demographic information for the Short Creek area (Hildale city, Utah, Colorado City town, Arizona, and Centenial Park, Arizona), with population data disaggregated by 15 age categories. This dataset matches the short_creek_matrix matrix.
This data uses real vaccination rates from publicly available school records, and population age structure and composition from the latest US census. Vaccination rates for the non-school-aged population were imputed based on assumptions and do not reflect the actual vaccination information for those age groups.
Source
The data was generated using the multigroup.vaccine R package:
Toth D (2025). multigroup.vaccine: Multigroup Vaccine Model. R
package version 0.1.0, commit 3047ebf568c9b2028336dc14af587a282de9e225,
https://github.com/EpiForeSITE/multigroup-vaccine. The source code
is available at https://github.com/UofUEpiBio/measles
Examples
data(short_creek)
head(short_creek)
Short Creek Mixing Matrix
Description
A matrix containing spatial data for the Short Creek area (Hildale city, Utah, Colorado City town, Arizona, and Centenial Park, Arizona). The matrix provides an estimate of the mixing rates between schools and the rest of the population in the area.
Usage
short_creek_matrix
Format
A row-stochastic matrix (rows add up to one) with 15 rows and 15 columns with the
Source
The data was generated using the multigroup.vaccine R package:
Toth D (2025). multigroup.vaccine: Multigroup Vaccine Model. R
package version 0.1.0, commit 3047ebf568c9b2028336dc14af587a282de9e225,
https://github.com/EpiForeSITE/multigroup-vaccine. The source code
is available at https://github.com/UofUEpiBio/measles