
“animbook” is a package to help the user visualize the changes in performance measures and demographic affiliations using animation. It is a package to help prepare, plot, and animate the data.
You can install the development version of animbook from GitHub with:
install.packages("animbook")library(animbook)
library(dplyr)data <- osiris |>
filter(country %in% c("US", "JP"))
label <- c("Top 25%", "25-50", "50-75", "75-100", "Not listed")
accounting <- anim_prep(data,
id = ID,
values = sales,
time = year,
label = label,
ncat = 4,
group = country)
p <- wallaby_plot(accounting,
group_palette = RColorBrewer::brewer.pal(9, "Set1"),
shade_palette = c("#777777", "#777777", "#777777",
"#777777", "#777777"),
subset = "bottom",
relation = "many_one",
height = 1,
size = 2,
width = 100,
total_point = 1000)
#> You can now use the animbook::anim_animate() function to
#> transform it into an animated object
p2 <- anim_animate(p)
#> You can now pass it to gganimate::animate().
#> The recommended setting is nframes = 139
gganimate::animate(p2)
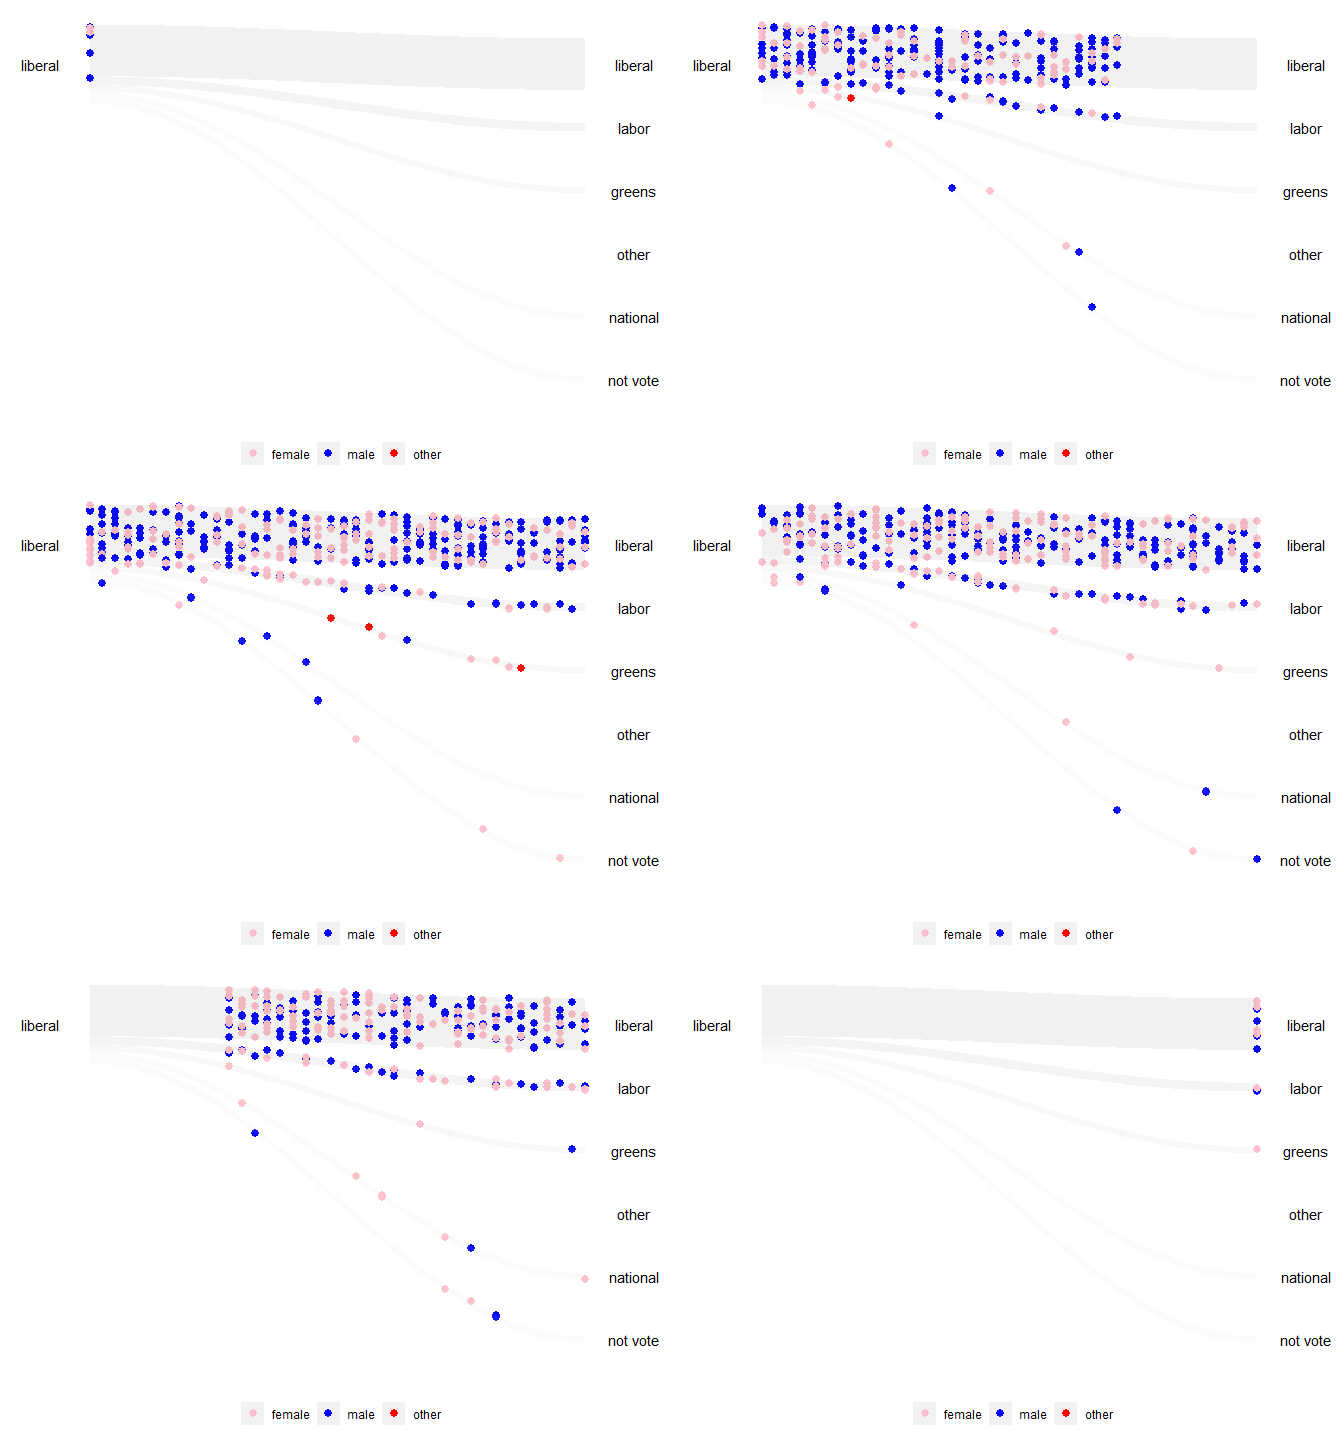
All the companies in the Top 25% were US companies. Any Japanese companies in the Top 25% in 2006 did not exit the market (Not listed). It is worth noting that in 2006, there were no Japanese companies in the Top 25%. It is also interesting that a large proportion of companies in the Top 25% are being de-listed, and the lower the quartile, the less likely the companies are to exit the market.
library(animbook)

voter <- anim_prep_cat(data = aeles,
                       id = id,
                       values = party,
                       time = year,
                       group = gender,
                       order = NULL)

p_voter <- wallaby_plot(data = voter,
                  group_palette = c("pink", "blue", "red"),
                  shade_palette = c("#777777", "#777777", "#777777",
                                    "#777777", "#777777", "#777777"),
                  time_dependent = FALSE,
                  rendering = "gganimate",
                  subset = "top",
                  relation = "one_many",
                  height = 1,
                  size = 2.5,
                  width = 100,
                  total_point = 1000)
#> You can now use the animbook::anim_animate() function to
#>           transform it into an animated object

p2_voter <- anim_animate(p_voter)
#> You can now pass it to gganimate::animate().
#>                    The recommended setting is nframes = 139

gganimate::animate(p2_voter)
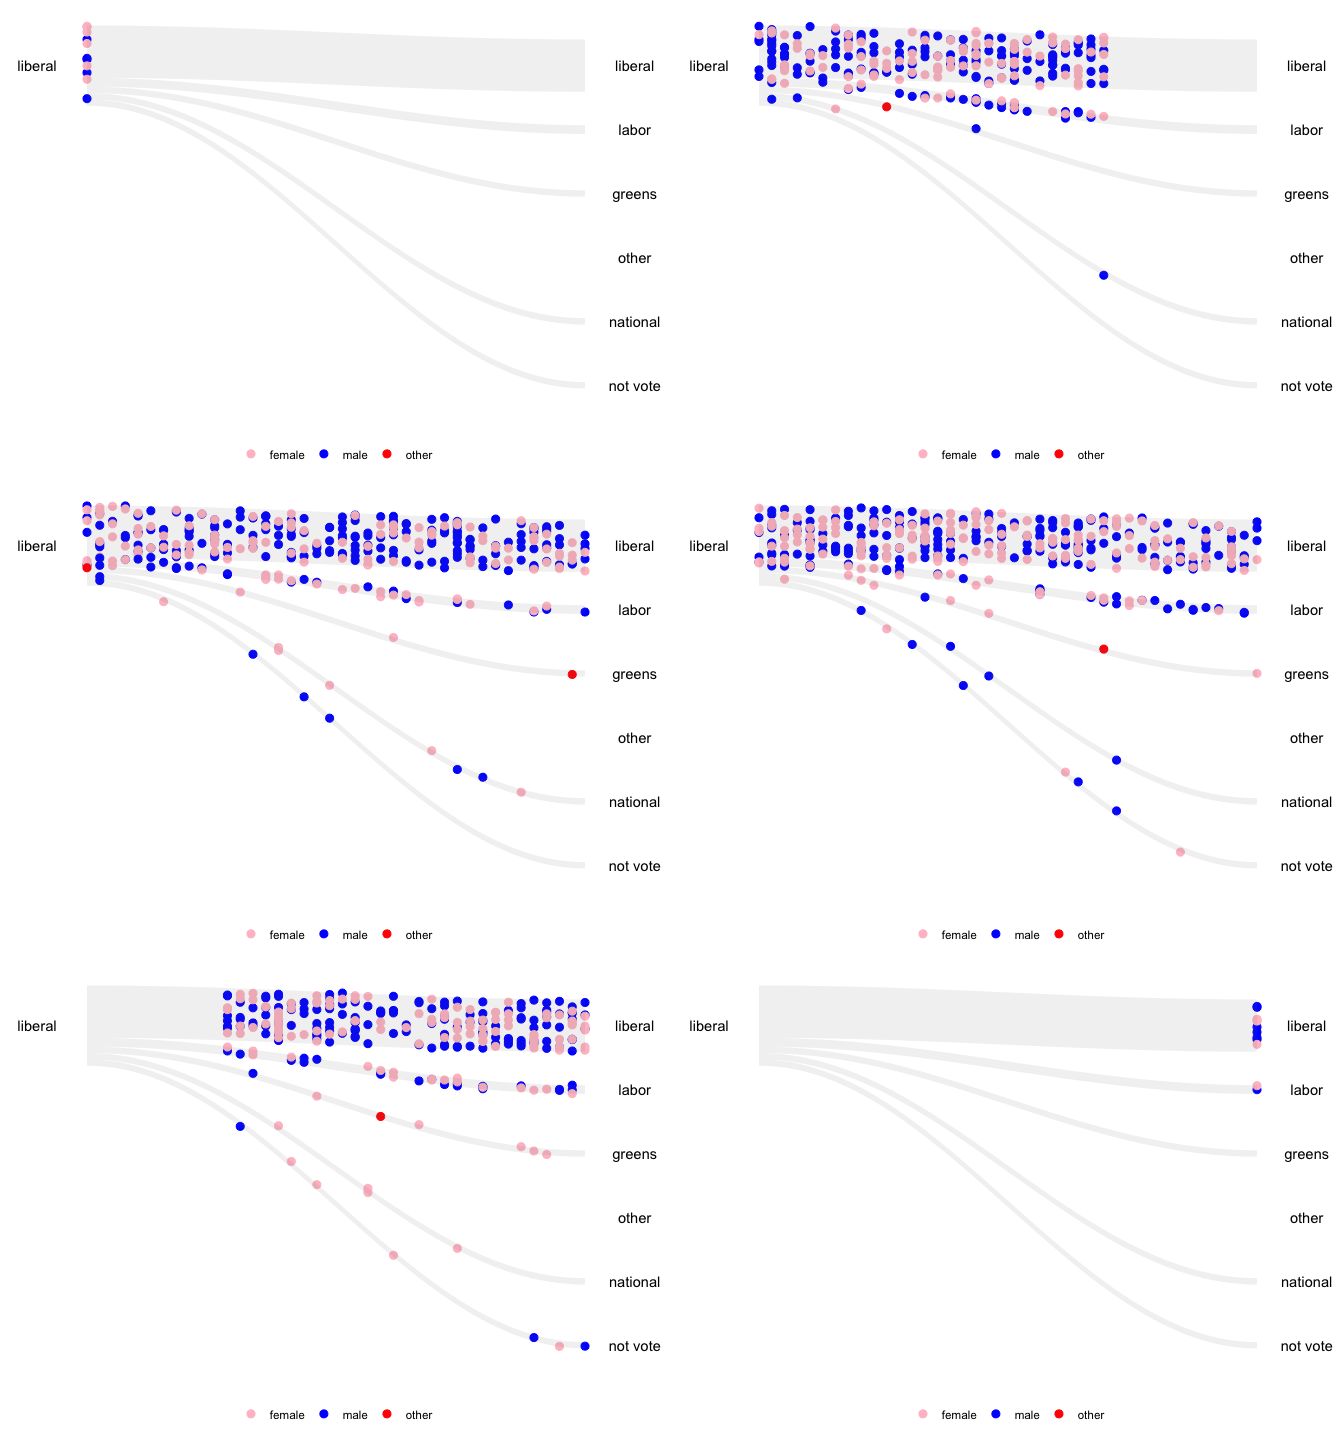
It reveals a pattern where individuals who identified their gender as ‘others’ have shifted their voting preference from the Liberal Party, the leading party in 2006, to the Greens Party.