 |
| Equal-quality contours are drawn at -0.5, -1, -2, and -3. |
The automated testing routine for CELT involves running roughly 6 months of audio through the CELT encoder and decoder across a wide variety of modes and configurations. All user accessible modes receive at least some level of coverage. 48kHz mono receives automated quality testing of all frame sizes and most reasonable bit-rates. Common configurations receive extensive fuzz testing under valgrind. ARM (OpenMoko), x86_64 (Fedora 10), and x86 (Fedora 10) are used in testing.
This level of extensive testing is made possible by the large multiple of real-time that CELT operates at on modern computing hardware.
Keep in mind that as of 0.5.2 CELT is still a work in progress. Neither the API/ABI, nor the bit-stream are stable. Also, while we do not expect it to set your house on fire, we cannot guarantee that it won't. Spontaneous combustion is specifically not covered by these tests.
| Value | Meaning |
|---|---|
| 0 | Imperceptible |
| -1 | Perceptible but not annoying |
| -2 | Slightly annoying |
| -3 | Annoying |
| -4 | Very annoying |
The quality of CELT 0.5.2 at 48 kHz mono was assessed for 51,848 combinations of bitrate, frame size, and complexity using PQEvalAudio, an implementation of PEAQ. The PEAQ objective difference grade does not always accurately reflect human opinion but its automated nature permits testing large numbers of configurations. These quality tests would require over 52 days of continuous listening if conducted with a single human reviewer.
This illustration demonstrates the quality/bitrate/delay trade-offs available in CELT in full (default) complexity mode.
|
| Equal-quality contours are drawn at -0.5, -1, -2, and -3. |
This illustration demonstrates the quality/bitrate/delay trade-offs available in CELT in low complexity mode.
 |
| Equal-quality contours are drawn at -0.5, -1, -2, and -3. |
For each test point the 0.5.1 PQEvalAudio score was subtracted from the CELT 0.5.2 score.
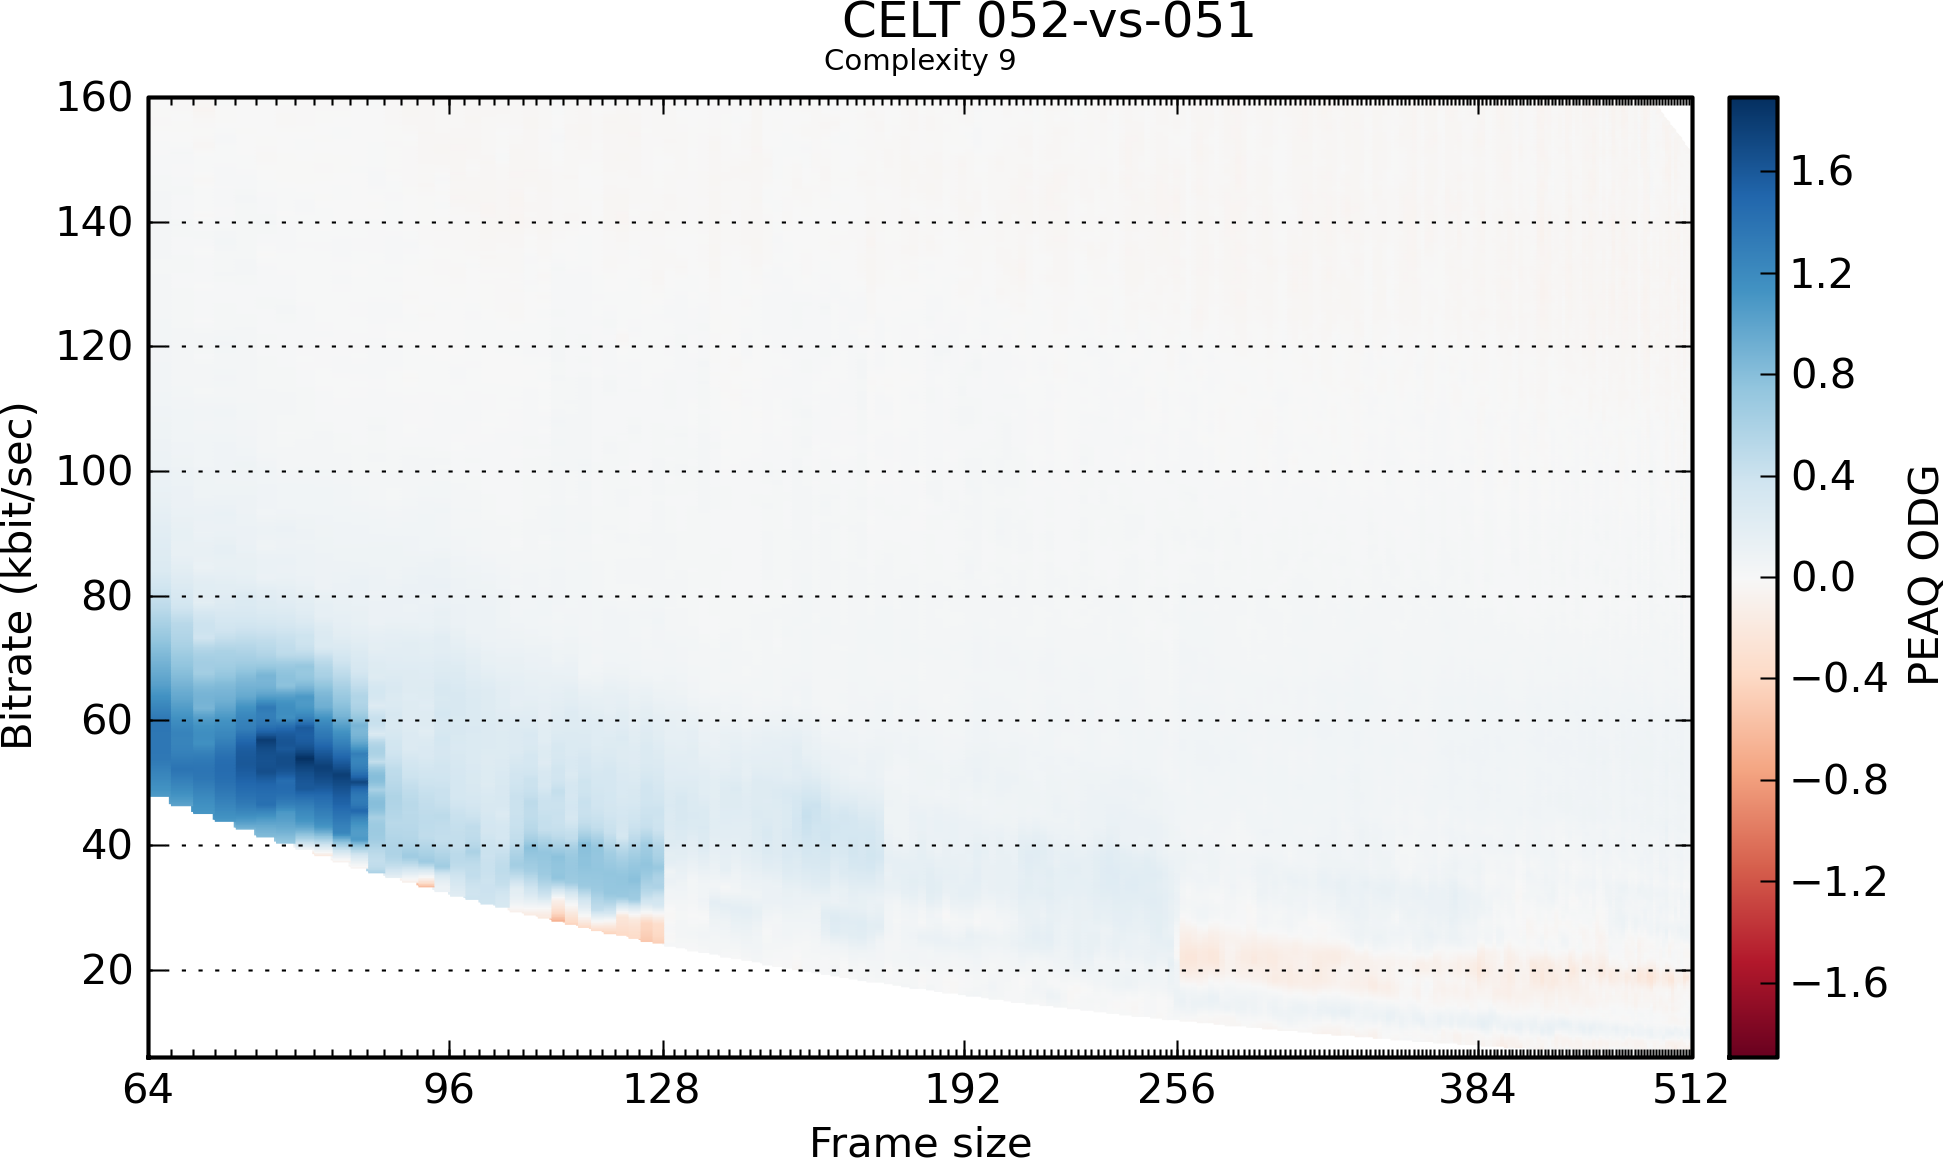 |
| Positive (blue) values in the chart indicate improvement according to PQEvalAudio, while negative (red) values indicate quality loss. |
For each test point the 0.5.1 PQEvalAudio score was subtracted from the CELT 0.5.2 score.
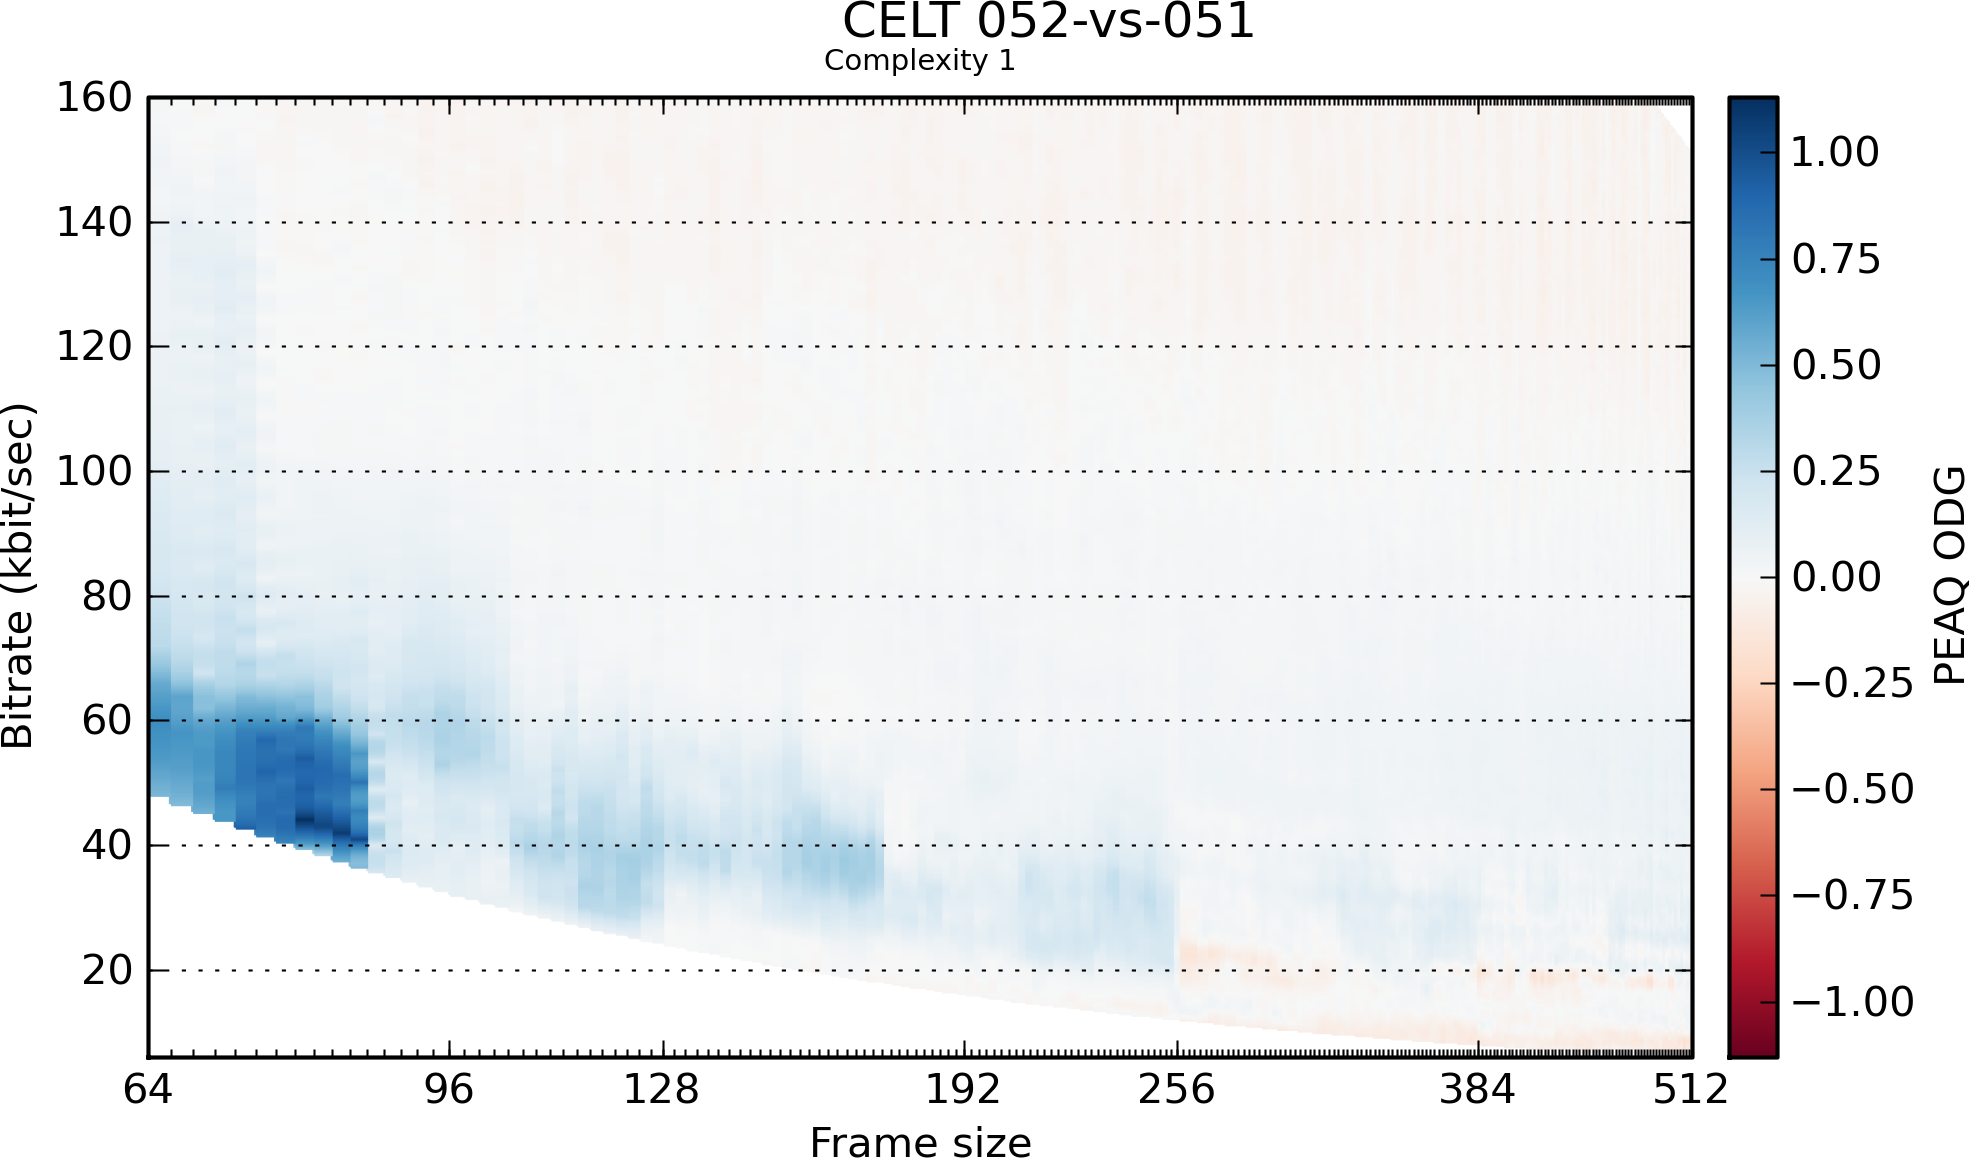 |
| Positive (blue) values in the chart indicate improvement according to PQEvalAudio, while negative (red) values indicate quality loss. |
CELT includes a number of unit tests that exercises internal components of CELT.
| Test | x86_64 | x86 | ARM |
|---|---|---|---|
| cwrs32-test | Pass | Pass | Pass |
| dft-test | Pass | Pass | Pass |
| ectest | Pass | Pass | Pass |
| laplace-test | Pass | Pass | Pass |
| mathops-test | Pass | Pass | Pass |
| mdct-test | Pass | Pass | Pass |
| real-fft-test | Pass | Pass | Pass |
| type-test | Pass | Pass | Pass |